Improve custom Hook debugging with useDebugValue
Not too many developers know about the useDebugValue Hook, although it provides a much better debugging experience when it comes to debugging custom Hooks.
Originally published at blog.logrocket.com
useDebugValue is a simple inbuilt Hook that provides more information about the internal logic of a custom Hook within the React DevTools). It allows you to display additional, helpful information next to your custom Hooks, with optional formatting.
useDebugValue and React DevTools
useDebugValue extends the visualization of data about custom Hooks inside of the Component Inspector of the React DevTools. You can install the React DevTools as a standalone app or as a browser extension.
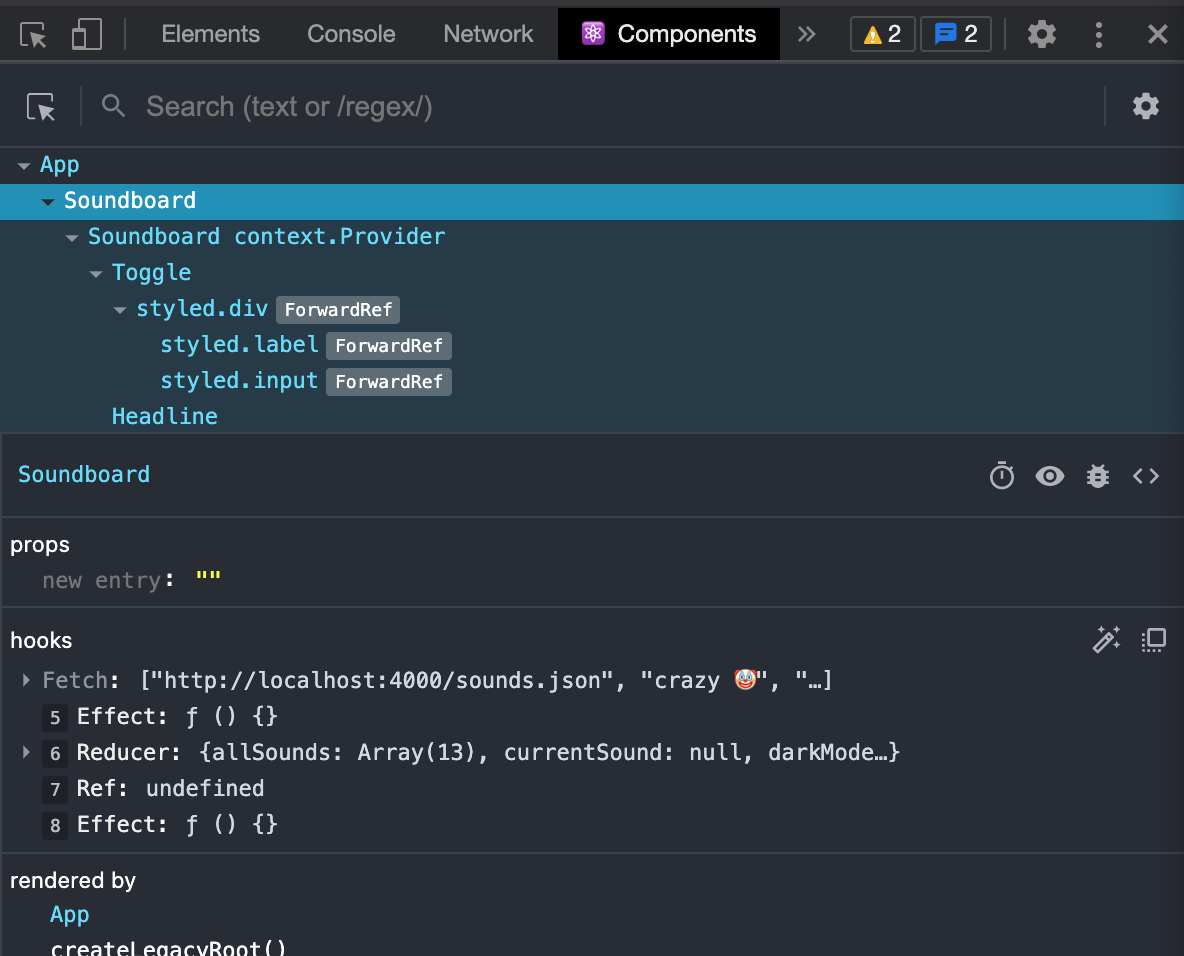
The next screenshot shows the Components tab of the React DevTools Chrome extension.

Let’s look at how we can make use of the useDebugValue Hook. Consider this rather simplified custom fetch Hook.
import { useEffect, useState } from "react";

export const useFetch = (url) => {
    const [response, setResponse] = useState([]);
    const [error, setError] = useState(null);
    useEffect(() => {
    async function fetchFiles() {
        try {
        const response = await fetch(url);
        const json = await response.json();
        setResponse(json);
        } catch (error) {
        setError(error);
        }
    }
    fetchFiles();
    }, [setError, setResponse, url]);
    return [response, error];
};
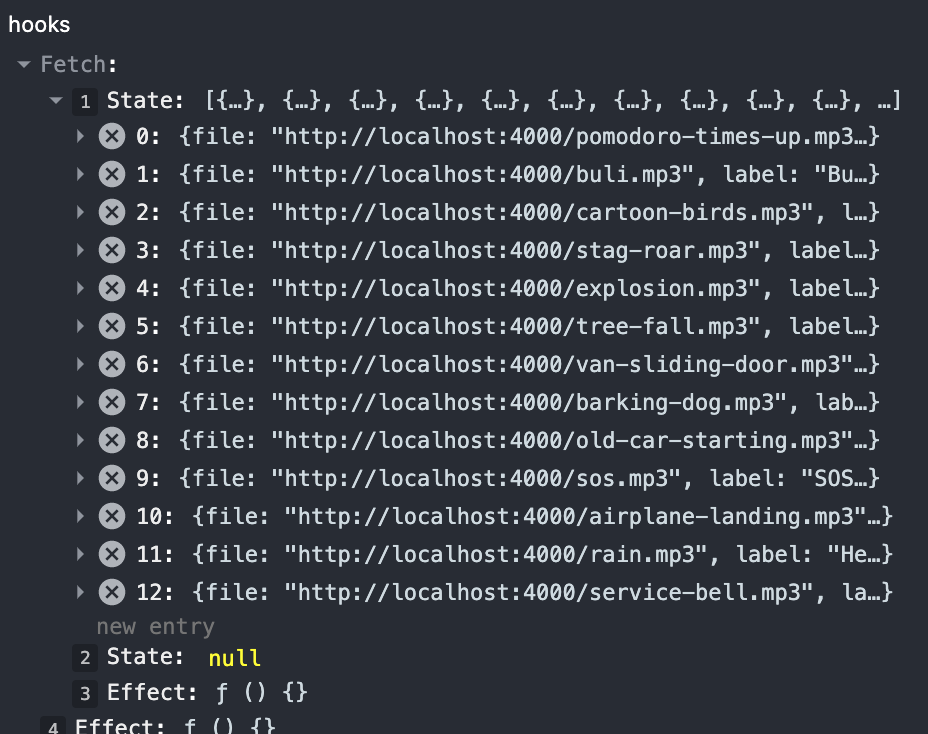
This is how data about the Hook is displayed.

Debug information is limited to only displaying information about the other inbuilt React Hooks used inside of our Hook (in this case, useState and useEffect). In addition, the information is hard to read because there are no descriptive labels — you have to count each line in the output in order to know which entry maps correspond to the Hooks called inside of your codebase.
With the help of the inbuilt useDebugValue Hook, we can improve this situation by adding additional entries to the React DevTools output for our custom Hook.
import { useEffect, useDebugValue, useState } from "react";

export const useFetch = (url) => {
    useDebugValue(url);
    const [response, setResponse] = useState([]);
    const clown = "🤡";
    useDebugValue(`crazy ${clown}`);
    const [error, setError] = useState(null);
    const [httpResponse, setHttpResponse] = useState();
    useDebugValue(
    httpResponse ? "status code " + httpResponse.status : "no response"
    );
    useDebugValue(error, (e) =>
    e ? `fetch failed due to ${e.message}` : "fetch successful"
    );
    useEffect(() => {
    async function fetchFiles() {
        try {
        const response = await fetch(url);
        setHttpResponse(response);
        const json = await response.json();
        setResponse(json);
        } catch (error) {
        setError(error);
        }
    }
    fetchFiles();
    }, [setError, setResponse, url]);
    useDebugValue(response, (mp3s) =>
    mp3s.length > 0 ? mp3s.map((mp3) => mp3.label) : "no mp3s loaded"
    );
    return [response, error];
}
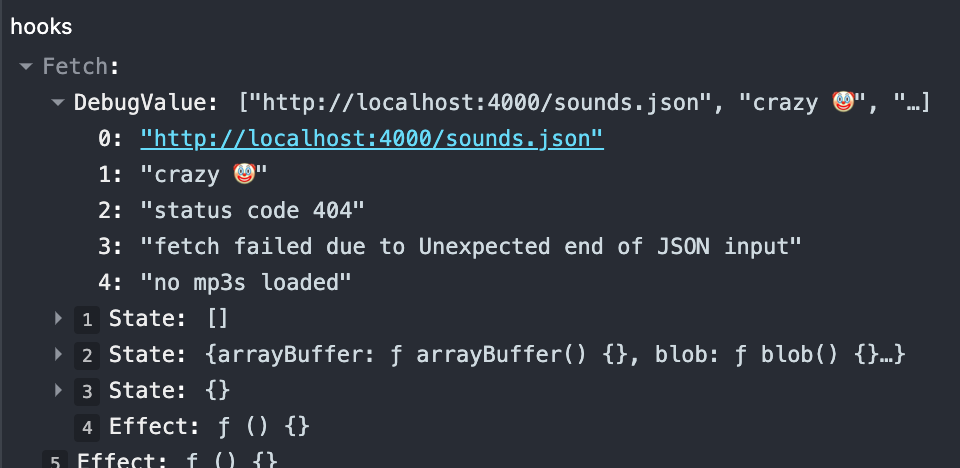
The next screenshot shows what the output looks like in the event of a network error.

The expanded DebugValue entry lists the outputs of the useDebugValue calls in the order they occur in the source code. The different entries show how you can leverage this Hook. The clown entry is not meant so seriously, but it shows that you can log out anything you want — numbers, strings, and objects, not just function parameters or state variables of the custom Hook.
Entries three to five demonstrate the optional second argument use of the useDebugValue Hook. The second argument is a callback function that receives the data specified in the first argument and is meant to return a formatted display value.
This exists so as to defer formatting in the event that calculating the value to display is expensive. If you use the second argument, this function is first executed when you inspect the custom Hook in the React DevTools.
Limitations of useDebugValue
Of course, you cannot use useDebugValue to log out conditional and nested data due to the Rules of Hooks.
That’s why I came up with an additional state variable, httpResponse, in the example above, to get access to the response’s status code. As a reminder, this is due to the Rules of Hooks, which only allow Hooks to be used in the top level of a functional React component or custom Hook.
According to the official documentation, useDebugValue can only be used in the context of a custom Hook. If you put a Hook call on the top level of a React functional component, no log output will occur in React DevTools.
const AwesomeComponent = () => {
    useDebugValue("hey there"); // this does not work
    return <div>what's up?</div>;
};
Improving the React DevTools output for useState debugging
This section demonstrates how to use the useDebugValue Hook to improve debugging information with respect to the useState Hook.
You might be familiar with the traceability problem of React DevTools when you use a couple of useState Hooks inside of a component or custom Hook: React DevTools does not show a descriptive label for state entries.
Below is what the output looks like with the useFetch Hook.

Imagine that you select a component with multiple boolean state variables. In the long run, it will be exhausting to always need to pay attention to their order so that you can associate the state entries to their corresponding useState calls in your source code.
It’s worth noting here that using multiple “atomic” state variables is the preferred way to go, rather than collecting every state “artifact” in a single object. Since the useState Hook does not provide something similar to the setState method, it is a bad idea to use the “class-based single state object pattern” because you have to take care to clone the complex state object completely and just update the relevant portion.
Let’s see how we can utilize useDebugState to our advantage in order to fix this issue. First, we need to create another custom Hook.
// useComponentState.js
import { useState, useDebugValue } from "react";

export function useComponentState(initialValue, name) {
    const [value, setValue] = useState(initialValue);
    useDebugValue(`${name}: ${value}`);
    return [value, setValue];
}
Let’s replace the useState calls in our useFetch Hook.
import { useEffect, useDebugValue } from "react";

import { useComponentState } from "./useComponentState";
const useFetch = (url) => {
    useDebugValue(url, (url) => `url: ${url}`);
    const [response, setResponse] = useComponentState([], "fetched mp3s");
    const [error, setError] = useComponentState(null, "fetch error");
    useEffect(() => {
    async function fetchFiles() {
        try {
        const response = await fetch(url);
        const json = await response.json();
        setResponse(json);
        } catch (error) {
        setError(error);
        }
    }
    fetchFiles();
    }, [setError, setResponse, url]);
    useDebugValue(response, (mp3s) => mp3s.map((mp3) => mp3.label));
    return [response, error];
};
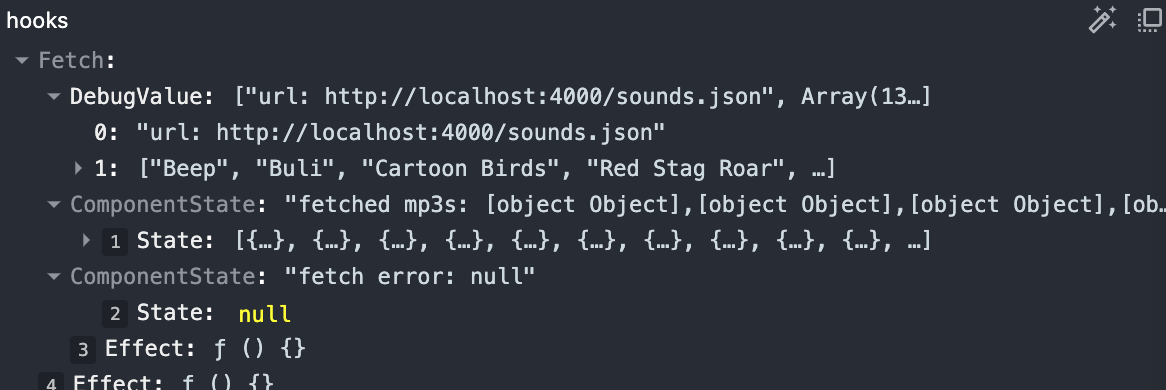
Now it looks like this. It’s easier to figure out where your state variables are displayed.

Everything comes with a cost
Using useDebugValue heavily in production code might impact the performance of your app negatively. I don’t think it’s a good idea to leave it in your production code, but as the official documentation states, leaving it in the code of custom Hooks in shared libraries might be fine.
Unfortunately, as of this article’s publication, there is no way to render useDebugValue conditionally based on environment variables because the rules of Hooks prevent a Hook call in conditional code.
For me, useDebugValue is another tool in my toolbox that I only use while developing custom Hooks and remove before pushing the Hook to the Git repository. It certainly constitutes an alternative to good old console.log calls and debug breakpoints.